Linear Analytics & Reports by Screenful
Create charts and scheduled reports from your Linear data
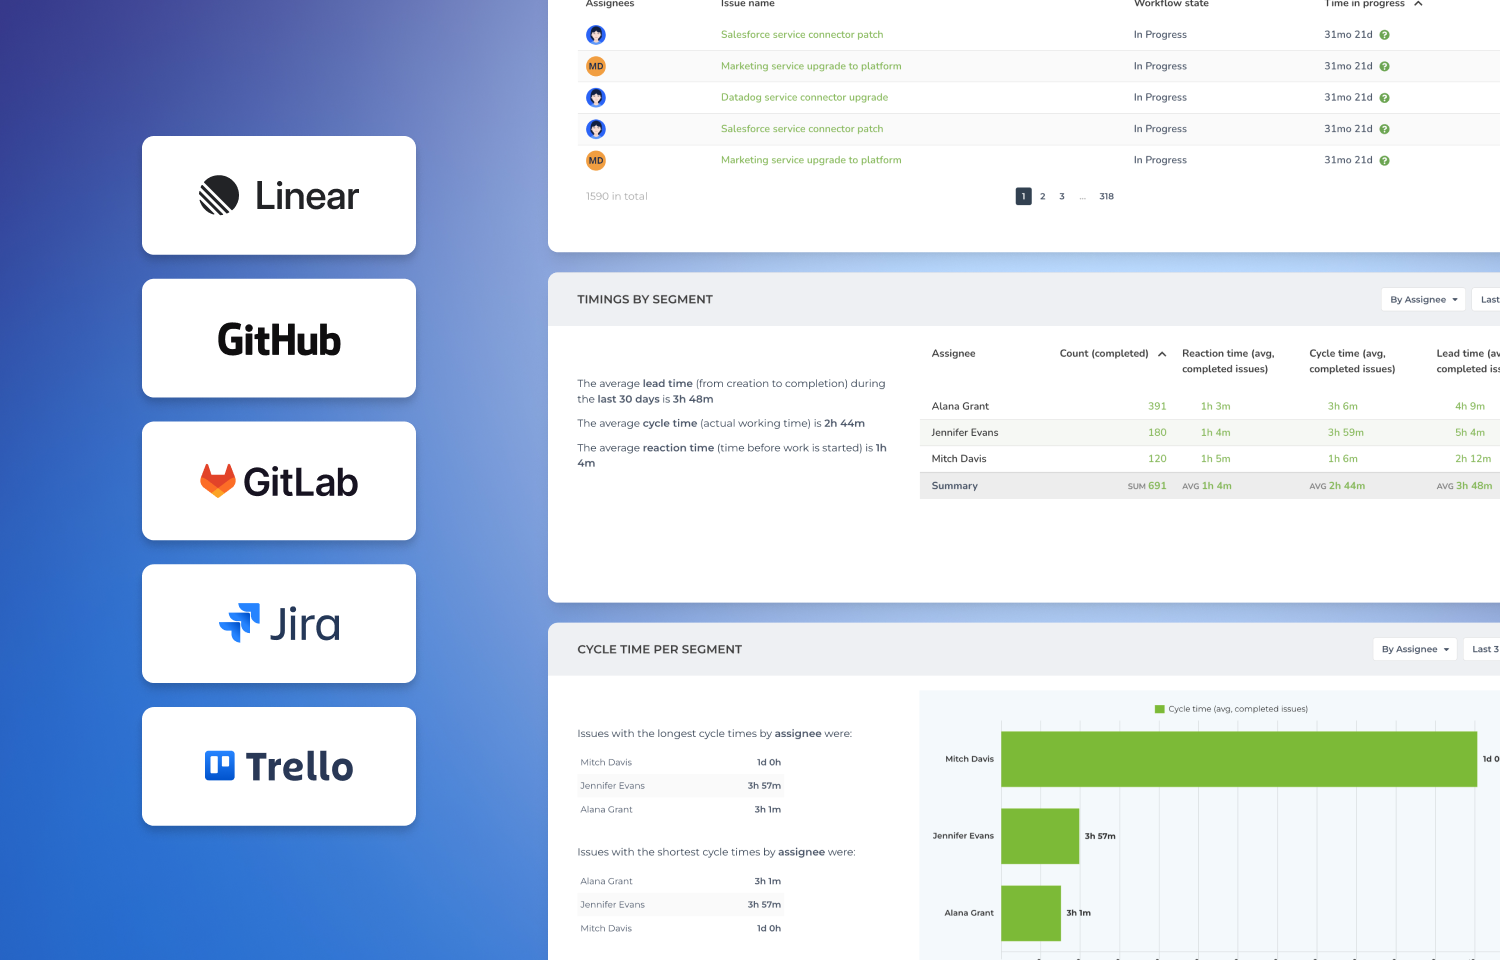
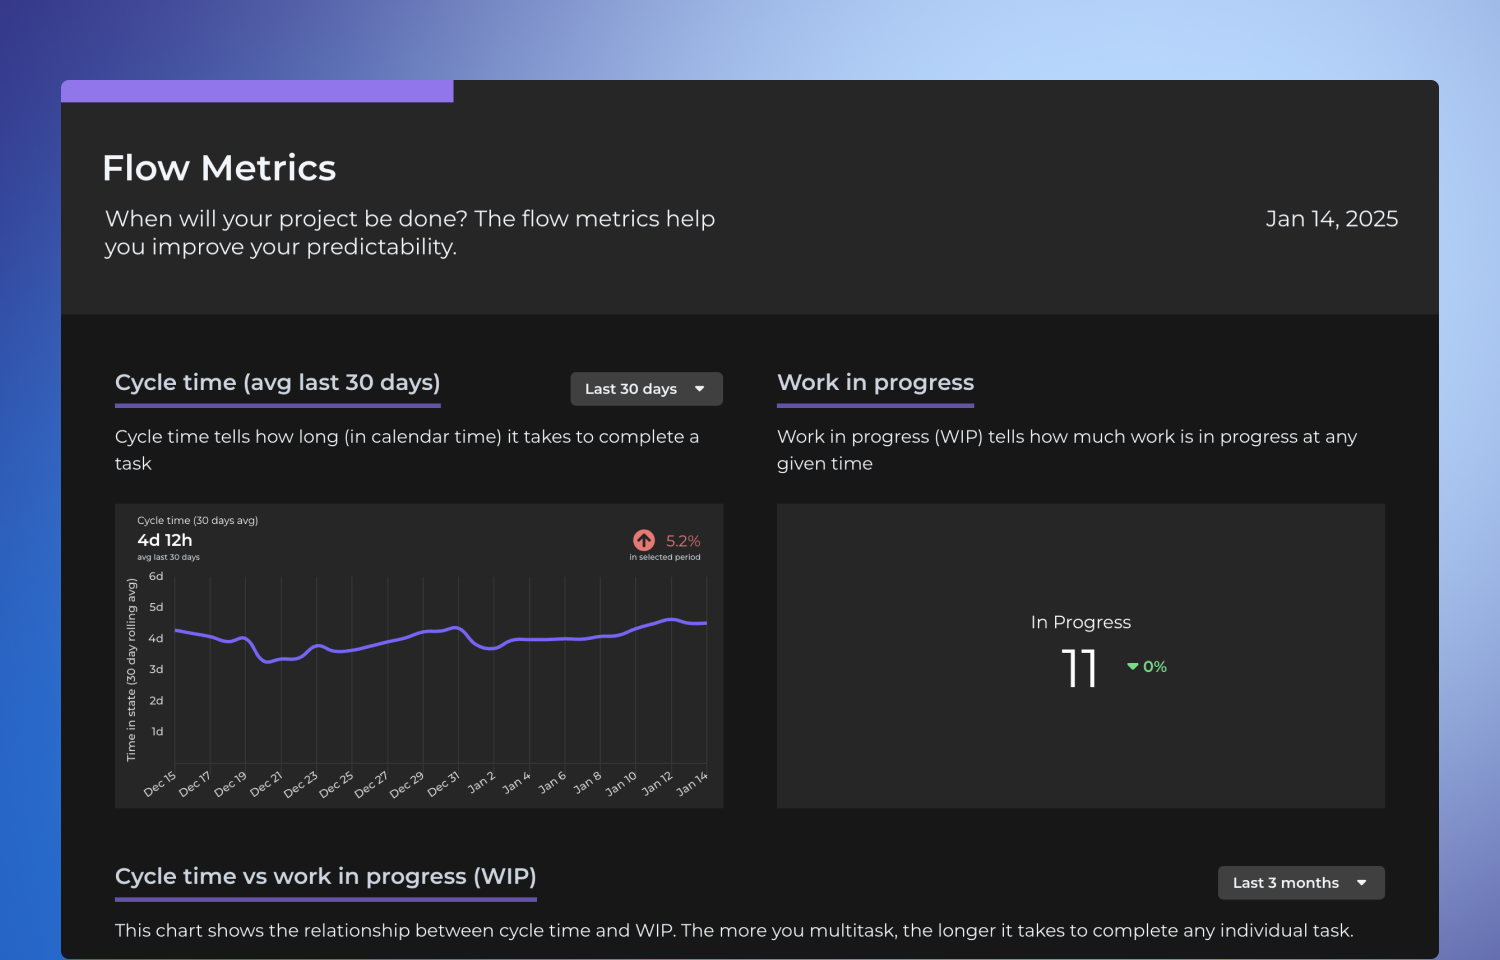
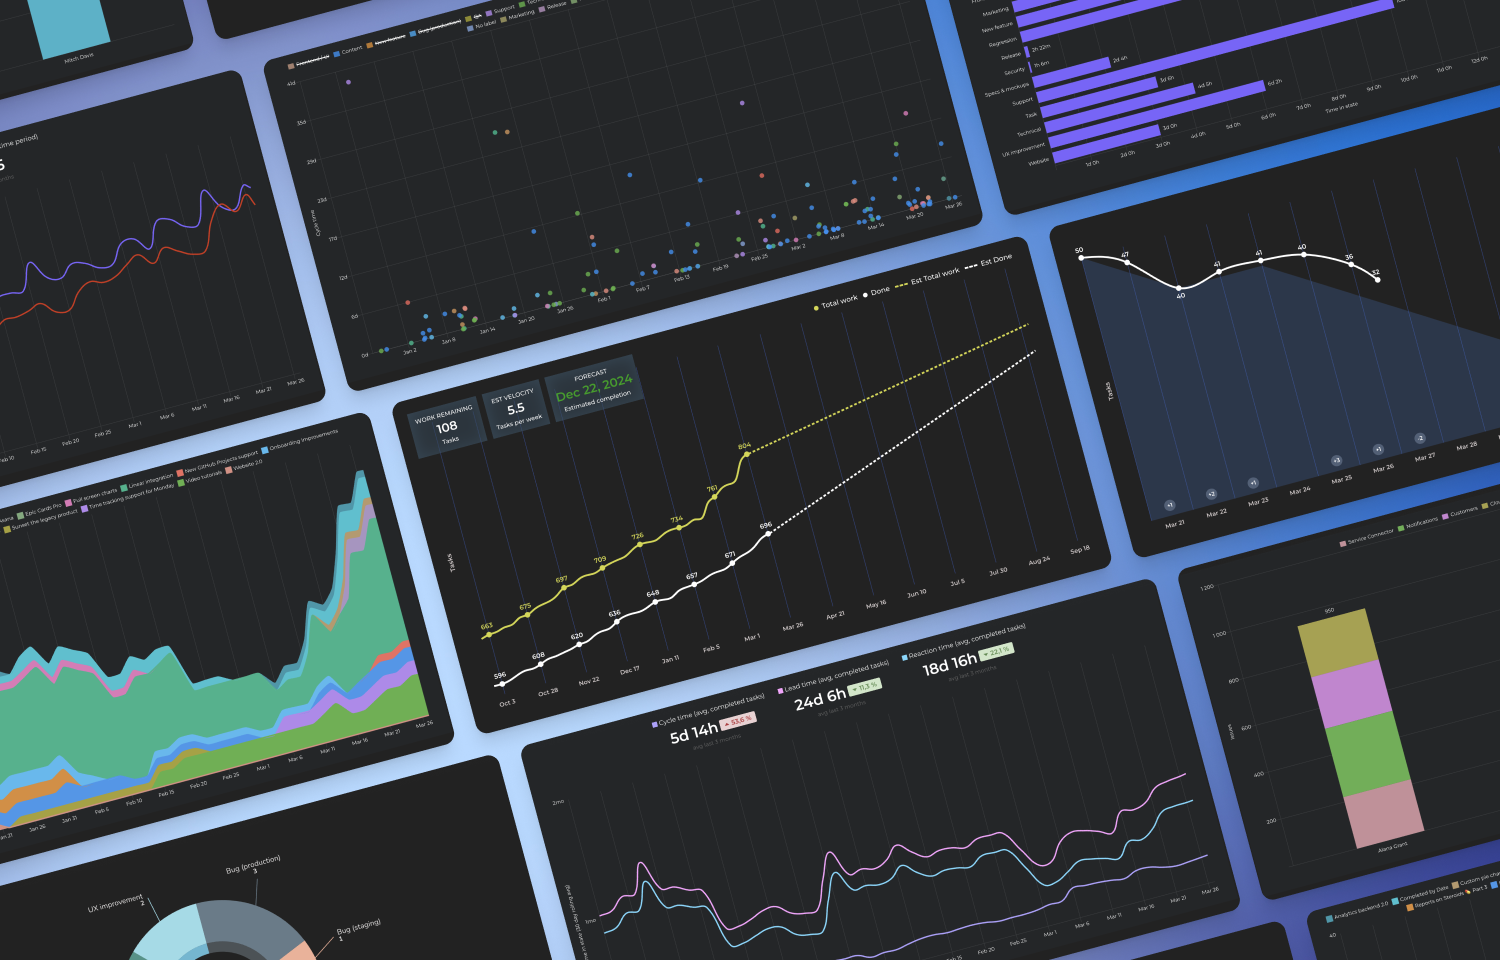
The quickest way to automate your Linear reporting! 15+ configurable charts. Track any metric, click through to see details. Use scheduled reports to share insights via email or Slack. Build advanced charts to track both issues and sub-issues with ease.